Wow, I was really into wgpu for a while there, huh? This is another quick graphics experiment I built, but this time the goal was to render the Mandelbrot Set fractal.
If you’ve never watched a zoom time-lapse of the Mandelbrot Set, I highly recommend it. Here’s an example. Maybe I’m just a nerd, but I find this absolutely beautiful. Seriously – it makes me emotional.
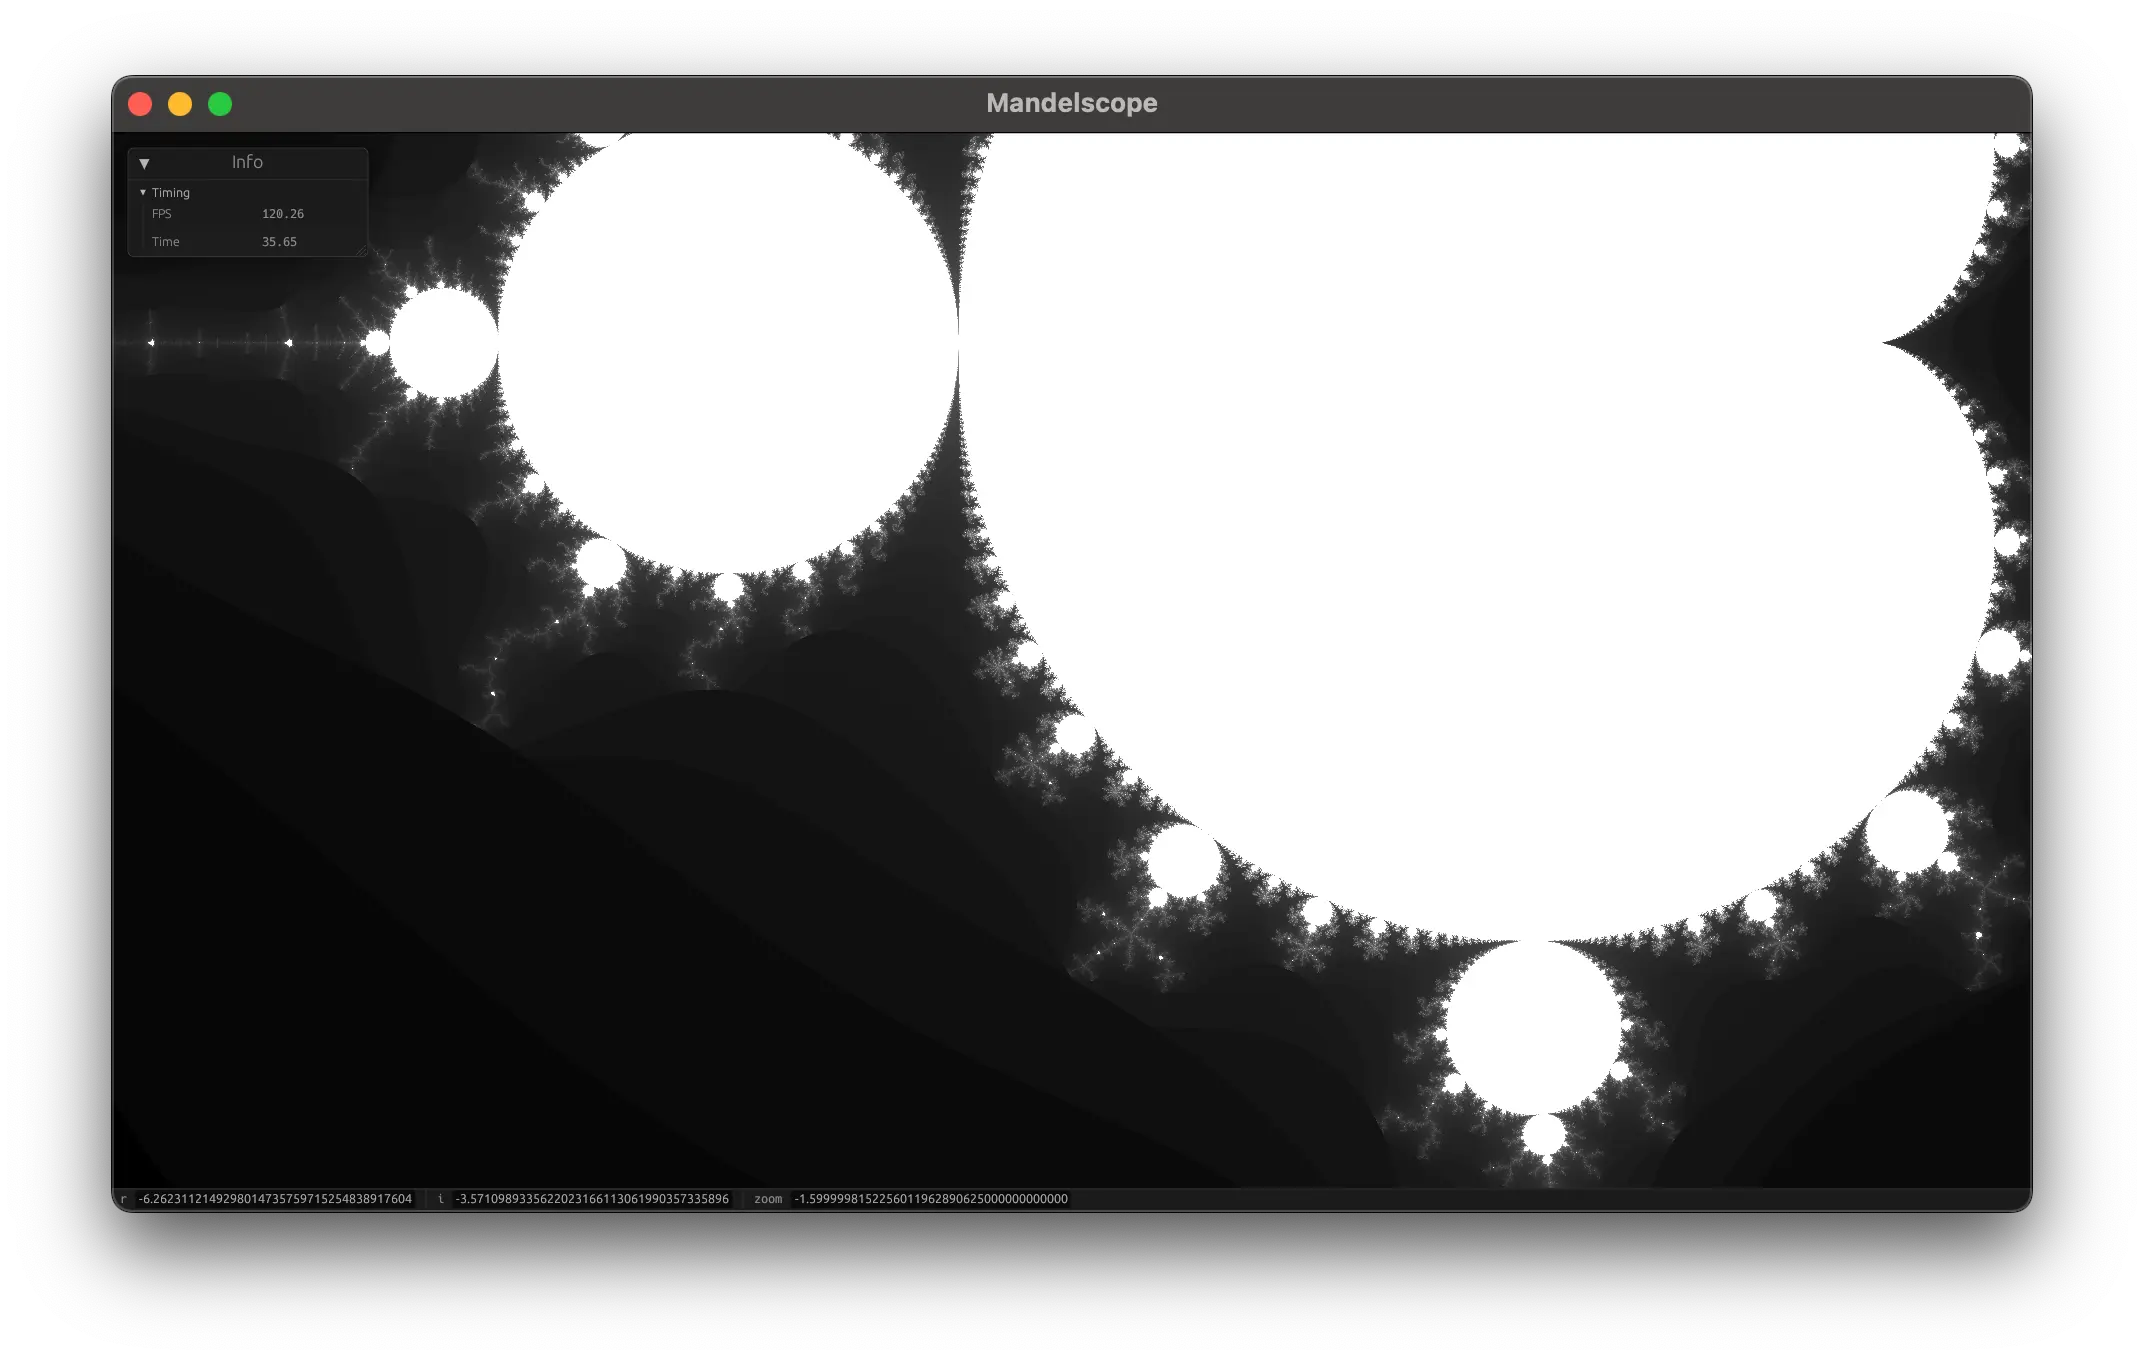
The Mandelbrot Set is a shockingly simple mathematical object. Basically, you take
the formula z = z^2 + c, where z is a complex number and c is a constant,
and iterate it. If the value of z stays bounded after some number of iterations,
then c is in the Mandelbrot Set. If it goes to infinity, then c is not in the
Mandelbrot Set. You can graph this with the real part of c on the x-axis
and the imaginary part of c on the y-axis, leaving you with a 2D image of the
Mandelbrot Set. The colors are determined by how quickly the value of z goes
to infinity, leaving you with a beautiful fractal image that can be zoomed into
infinitely.
It turns out that this is a pretty simple thing to implement in a compute shader –
each pixel represents the value of c, and the shader iterates the formula for each pixel
until it either goes to infinity or reaches a maximum number of iterations.
The tricky part of rendering the Mandelbrot Set is the zooming. As you start to
zoom in, you rapidly lose precision in the floating point representation of c, and
the image starts to look like a blurry mess. You can keep using larger and larger
floating point types, but without specialized graphics hardware, you’ll max out at either
32-bit or 64-bit floating point values. Additionally, as you zoom in you’ll need more and
more iterations in order to preserve detail, so you won’t get very far on the CPU either.
Despite this, people have been rendering the Mandelbrot Set at ridiculous zoom levels. For some perspective, the observable universe is about 10^62 Planck lengths across. It’s easy to find videos of people zooming in on the set to a scale of 10^245. That’s 10^183 times bigger in scale than that of our observable universe. It’s just nuts.
So how are people doing this? The trick is to use math, such as a technique
called Perturbation Theory. The key idea here is that as you zoom in, most of the pixels
to render are very close to each other, and the value of c is only slightly
different from the previous pixel. So instead of starting from scratch for each pixel,
you can compute a single “reference orbit” using a very high precision for a single
pixel, and then use that orbit to compute the value of c for the other pixels
by perturbing the reference orbit. This allows you to render the Mandelbrot Set at
extremely high zoom levels without losing detail, and without needing to use
ridiculously high precision floating point types. I’d be lying if I said I
fully understood how this works, but I did implement it and it sort of works.
Making a Mandelbrot Set viewer turns out to be a very deep rabbit hole. There’s a lot of math and theory behind it, and I’ve only scratched the surface. The existing implementations are a lot better than mine, so go check some of them out if you’re interested!